A single binary and an SSH connection — metrics, logs, and alerts for your Docker hosts. No Prometheus, no Grafana, no monitoring stack to maintain.
I built tori because I wanted to monitor a few Docker servers without deploying an entire observability platform. It connects over SSH, reads from /proc and the Docker socket, and gives you a terminal dashboard.
How it works #
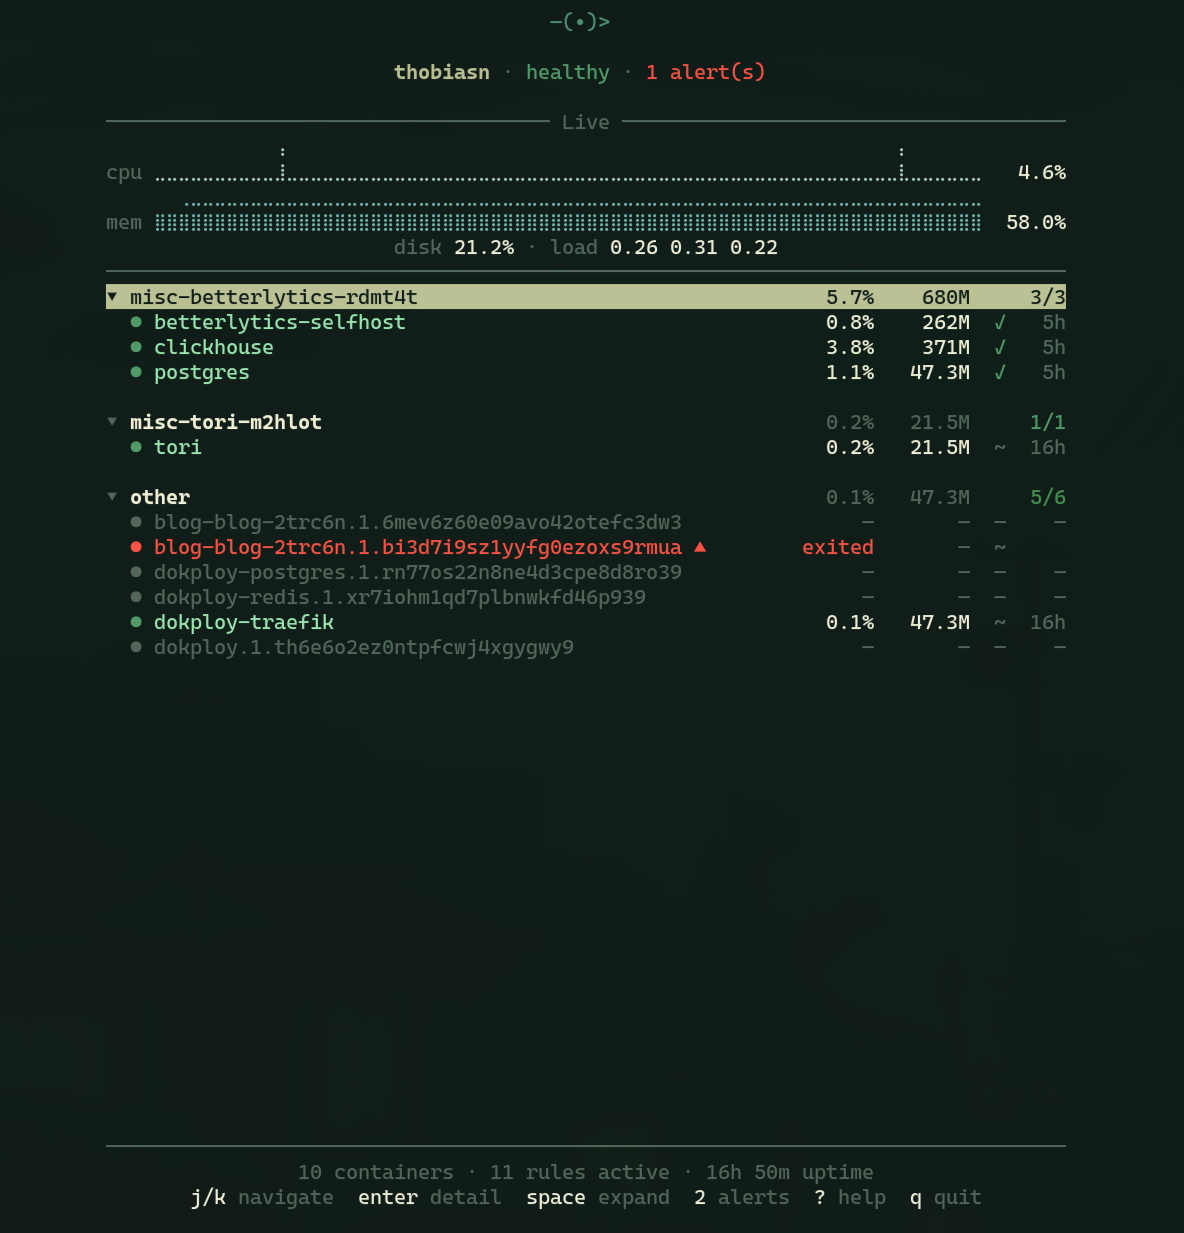
tori is a single binary split into two roles — an agent that runs on each server and a client that runs on your machine. The agent collects host metrics and container stats, stores them in SQLite, and exposes a Unix socket. The client SSH-tunnels to that socket and renders everything in a TUI.
No HTTP server, no API, no open ports. SSH is the only attack surface.
Features #
- Host metrics — CPU, memory, disk, network, swap, load averages with sparkline graphs
- Container monitoring — status, resource usage, health checks, restart tracking
- Log tailing — regex search, level filtering, date/time ranges, match highlighting
- Alerting — configurable rules with email (SMTP) and webhook notifications
- Multi-server — monitor multiple hosts concurrently from one terminal
Security #
Most monitoring tools add attack surface — dashboards, APIs, auth layers, open ports. tori doesn’t have any of that. The architecture is just a Unix socket and SSH, which means security comes from the design itself rather than bolted-on mitigations. Your servers don’t expose anything new, and the only auth you need is the SSH key you already have.
Tech #
- Go, single binary
- Bubbletea for the TUI
- SQLite for metric storage (configurable retention, 7 day default)
- Agent typically uses under 50 MB RAM
- Linux, macOS, Windows (WSL)
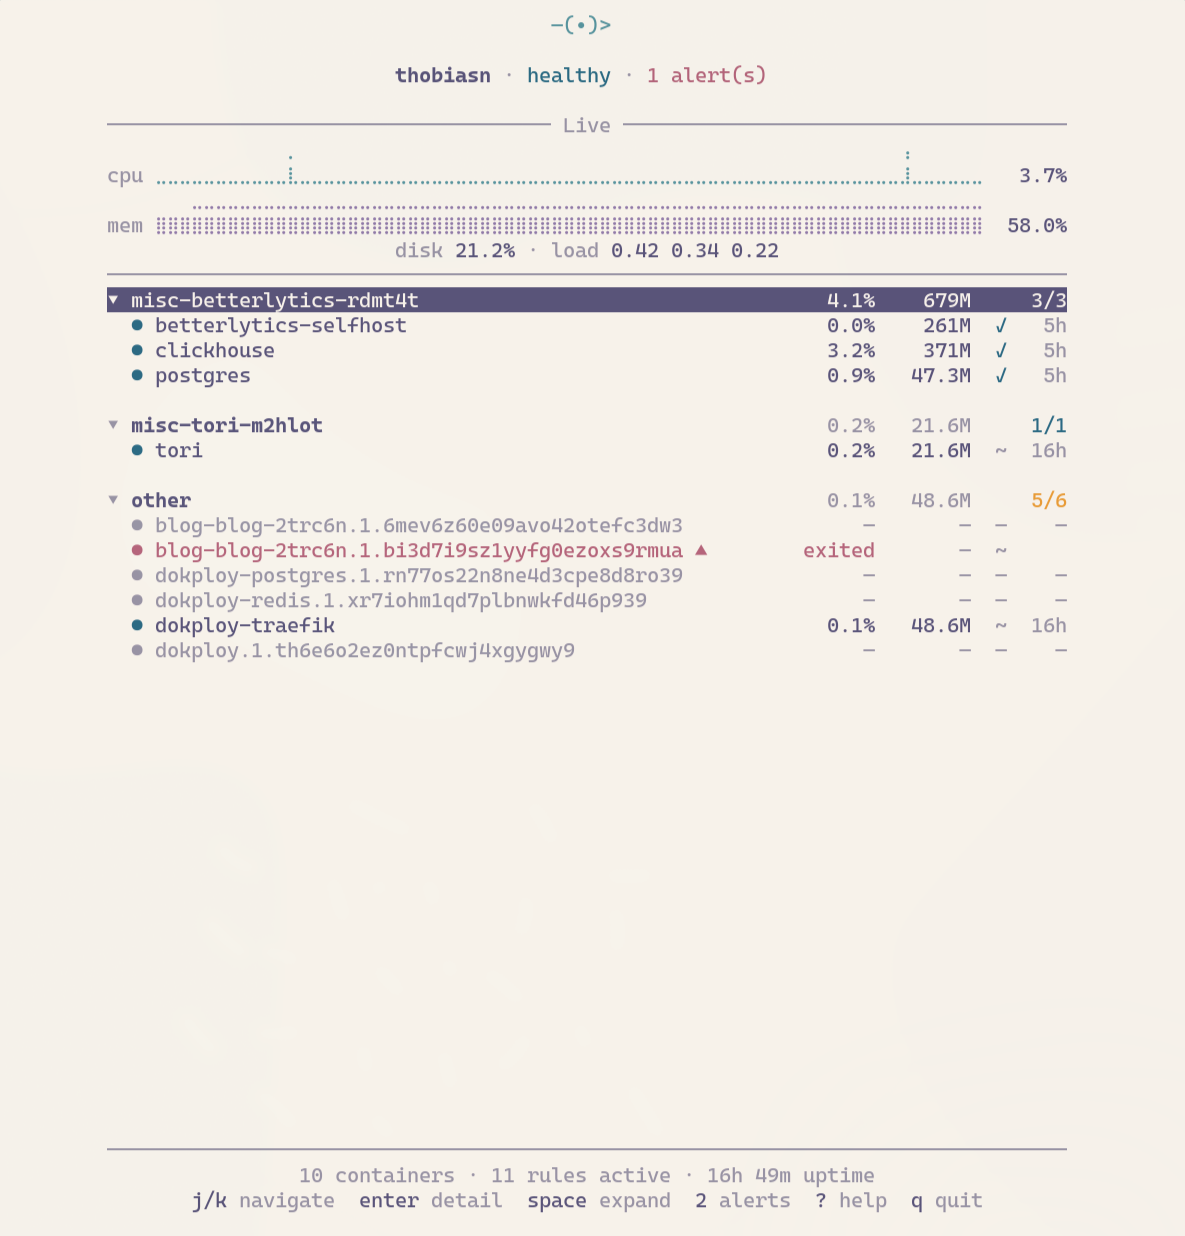
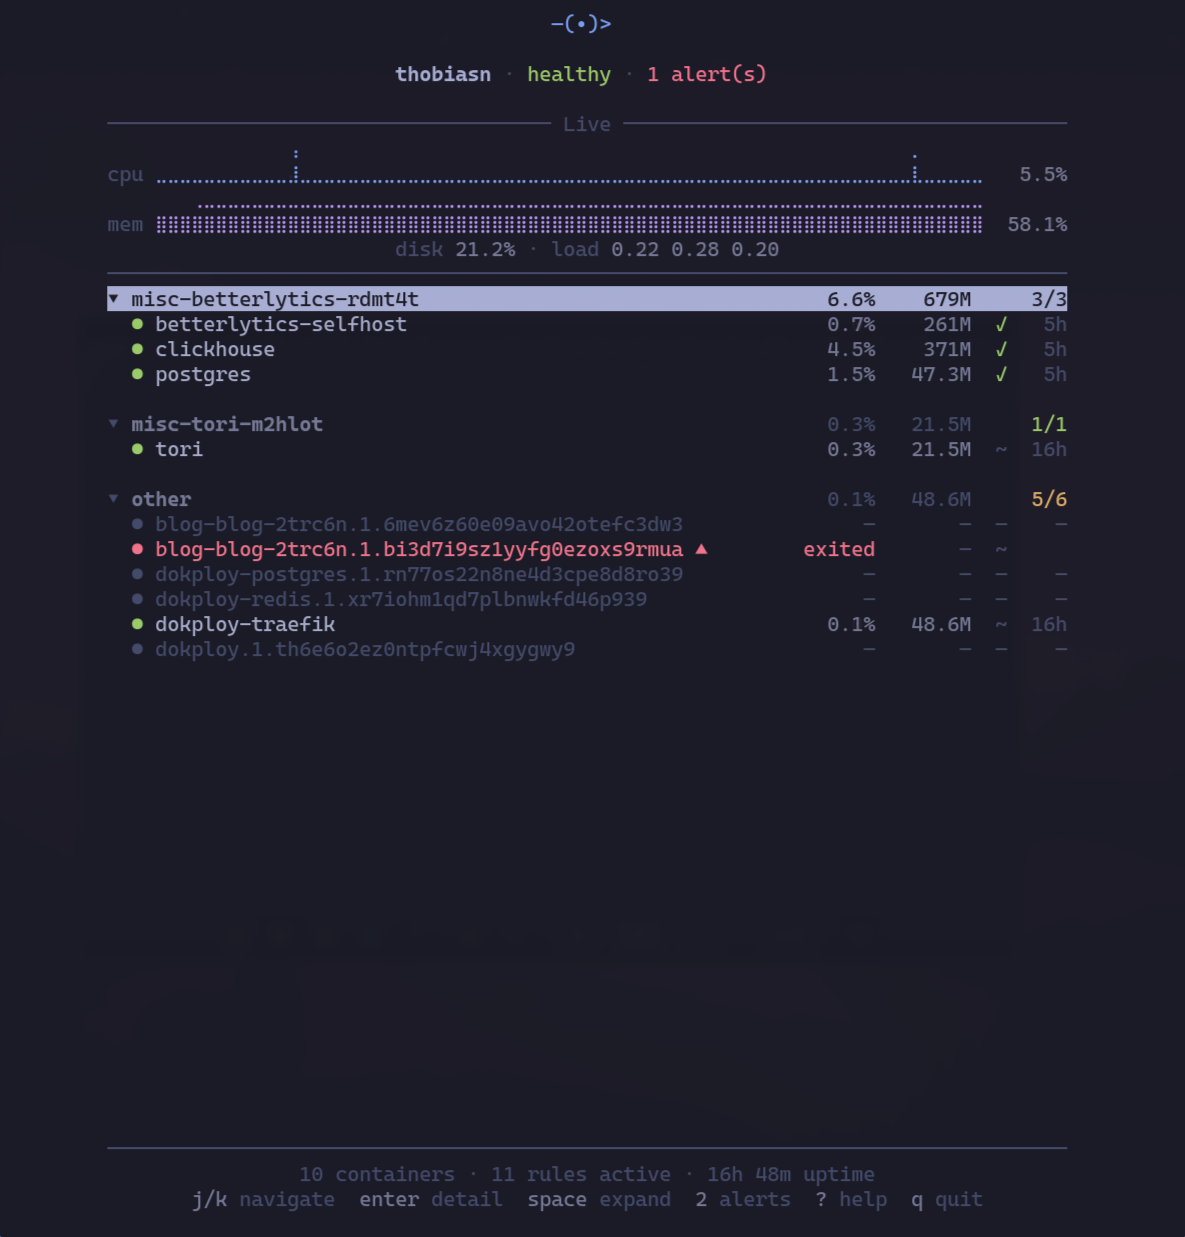
Themes #
tori uses ANSI colors by default, so it automatically matches whatever terminal theme you’re already running. If you want something different, every color is overridable in the config via 256-color or hex values.